Watch the first 2.5min of this exchange from last night’s Democratic Primary debate.
I was unable to find a good fact check or even good coverage of this exchange – only hot takes and cheers from the far left that “Mayo Pete” finally got his comeuppance. However, the claims made by the moderator were pretty complex, so I dug into the data and did the analysis myself.
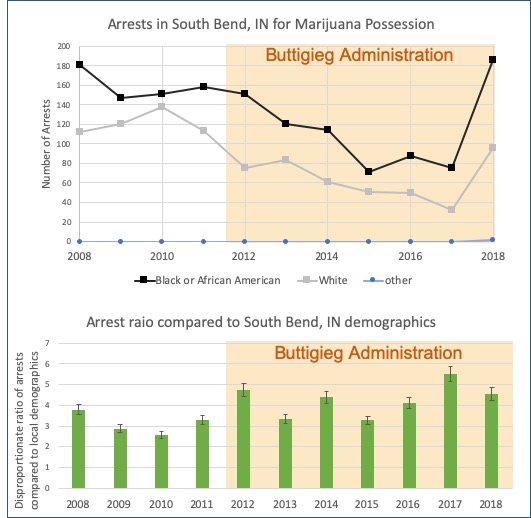
First, Davis’s initial, very precisely worded claim that the ratio of black to white arrests for marijuana possession went up during Buttigieg’s mayorship was correct, but a bit misleading. While the ratio of black to white arrests did go up after Buttigieg took office, the number of possession arrests for both white and black people went down significantly during his tenure.

Would it have been better if black arrests had gone down even more than for whites so that the ratio was closer to one? Sure, but did he make things better? Of course he did.
This data tells the story of the real left vs. far-left debate: Would black people in South Bend have been better off if Buttigieg had continued to arrest white people at the pre-2012 rate, making for a more equitable arrest ratio but arresting more people for a victimless crime? If you really understand these data and your answer is “yes”, I would suggest that you are are more interested in vengeance than justice or equality.
That debate aside, I must turn my ire to moderator Lindsey Davis. Like many journalists, she started with an interesting issue but brought more heat than light.
Davis pushed back against Buttigieg’s imprecise answer, and this is where she started making mistakes:
Davis: “How do you explain the increase in black arrests in South Bend under your leadership for marijuana possession?”
This statement is flat out false. For the data we have, the rate of black arrests was significantly lower under Buttigieg and continued to fall for most of his administration. She probably meant the ratio of black to white arrests, but that is a completely different claim.
Buttigieg: “and again, the overall rate was lower than the national rate…”
Davis: “No, there was an increase. The year before you were in office, it was lower, once you became in office in 2012, that number went up. In 2018, the last number year that we have record for, that number was still up”
Check out the data. Again, she’s probably meaning to say that the ratio of black to white arrests went up, which is true. However, what she is clearly saying, that the arrests of black people for possession went up, is wrong. Arrests of black people for possession went down while Buttigieg was mayor.
There was a spike in 2018, but this is clearly an outlier and arrests that year went up for both white and black people and the ratio held steady.
Buttigieg had an imprecise answer about his overall arrest rate, which isn’t quite the point I have been trying to make. Not unreasonably, he wasn’t completely up to speed on the data she was throwing at him. This is the actual “gotcha” journalism that I believe is unfair.
As I watched this exchange live, what I mostly bumped on was their use of rates, ratios, and percentages to describe arrests in a city of only about 100,000 people. That’s too small of a city to describe in such terms as opposed to absolute numbers. You could bust one big college party and see the rate skyrocket. However, I’m sure that this is not an argument that Mayor Pete wants to make: highlighting that his city was so small that you probably can’t learn much about his governance from data like this.
See what happens when journalists get sloppy… Warren jumped on Buttigieg not confronting the facts, the narrative about Pete’s performance gets distorted, we miss an important ideological debate, and already complex nomination process for the potential leader of the free world gets further confused.
METHODS: The demographic data for annual arrests for possession of marijuana in South Bend, IN was downloaded from the FBI, the same data Davis was citing. I tried to get a baseline of how demographics in the city have changed, but couldn’t find a breakdown from year to year. Instead, I combined the data from the 2000 and 2010 census and another survey from 2017 to get a baseline of 60.25±3.60% white and 25.66±0.66% black residents of South Bend, IN. These standard errors were then propagated to give a general sense of the variation in baseline.

